3 Projection Error
The purpose of this analysis is to evaluate location error introduced by different geospatial projections. The data used below are those stations where an animal of a given species was detected. Error will be evaluated by the deviation in calculated pairwise distances between stations along the geodesic (following the earth’s curvature, the “truth”) and in the plane of various projections. For this exercise, we compared the following projections:
- Universal Transverse Mercator (UTM) Zone 17
- UTM 18
- UTM 19
- pointwise auto-UTM selecting algorithm
- transverse Mercator at the median longitude
- Cassini at the median longitude (a transverse Mercator analog for the Plate Carrée)
- azimuthal equidistant projection at the median location
- oblique Mercator at the median location and the dominant aziumth calculated in the azimuthal equidistant projection
3.1 Per-species locations
3.1.1 Striped bass
Striped bass have the smallest range of the three species we’re investigating, ranging from southern Maine to the mouth of the Chesapeake.
3.1.2 Atlantic sturgeon
Atlantic sturgeon have the largest range, with detections from northern Maine to southern Florida.
3.1.3 Sand tiger shark
Sand tiger sharks are somewhere in the middle, ranging from central Florida to the tip of Long Island.
3.2 Distances
Sites ranged up to 966.4 km apart for striped bass, to 1823.5 km apart for sand tiger sharks, and to 2287.9 km apart for Atlantic sturgeon. The median location for Atlantic sturgeon and sand tiger sharks were similar and located near the mouth of the Delaware River, likely reflecting the dense array deployed by Delaware State University in the early 2010s. The median location for striped bass was around the middle coast of New Jersey, likely reflective of the dense array of Hudson River receivers deployed during that time.
Projected distances ranged up to 970 km, 1845 km for sand tiger sharks, and 2297 km for Atlantic sturgeon.
3.3 Errors
Important
Errors from the pointwise auto-UTM selecting algorithm were greater than the circumference of the Earth, indicating that the distance was calculated by going the wrong way around the world. We do not report on these.
Errors in projection ranged from 0 to just under 24 km. The azimuthal equidistant projection had the smallest root mean squared error (RMSE) across all species, followed by the Cassini, then the various Mercators. Striped bass tended to have the smallest projecton error, followed by sand tiger sharks, then Atlantic sturgeon. This likely reflects the different ranges of the fish – projection error is often greater between distant locations.
| species | min | median | mean | max | rmse |
|---|---|---|---|---|---|
| aeqd | |||||
| sb | 0 | 4 | 11 | 133 | 21 |
| atl | 0 | 4 | 23 | 2635 | 88 |
| st | 0 | 0 | 7 | 3159 | 44 |
| utm17 | |||||
| sb | 0 | 1125 | 1411 | 4976 | 1782 |
| atl | 0 | 705 | 1644 | 10812 | 2482 |
| st | 0 | 412 | 480 | 3302 | 659 |
| utm18 | |||||
| sb | 0 | 134 | 150 | 521 | 183 |
| atl | 0 | 211 | 349 | 2993 | 506 |
| st | 0 | 116 | 178 | 5803 | 419 |
| utm19 | |||||
| sb | 0 | 417 | 509 | 2179 | 654 |
| atl | 0 | 1248 | 3235 | 13853 | 4786 |
| st | 0 | 595 | 1945 | 23850 | 3409 |
| tm | |||||
| sb | 0 | 160 | 180 | 505 | 219 |
| atl | 0 | 224 | 317 | 2710 | 440 |
| st | 0 | 113 | 174 | 5583 | 403 |
| om | |||||
| sb | 0 | 81 | 92 | 409 | 117 |
| atl | 0 | 475 | 663 | 4267 | 941 |
| st | 0 | 7 | 221 | 6980 | 578 |
| cass | |||||
| sb | 0 | 34 | 44 | 381 | 60 |
| atl | 0 | 283 | 413 | 2715 | 594 |
| st | 0 | 6 | 149 | 4108 | 356 |
Deviation from the geodesic distance
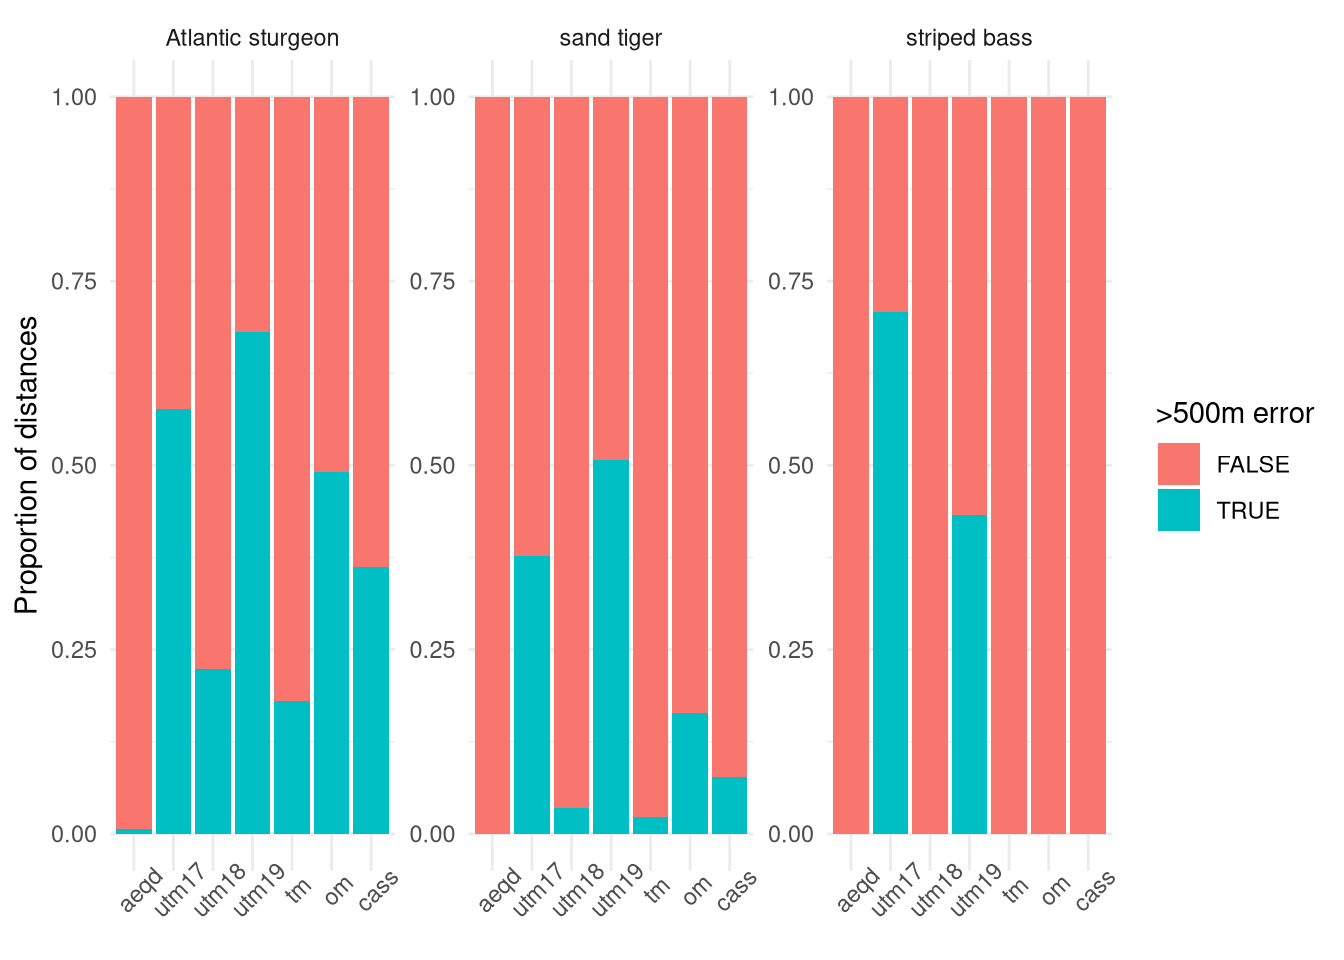
A general rule of thumb in acoustic telemetry is a 500 meter range of detection. As we are unable to resolve differences in distance less than 500 meters, errors less than 500 meters are, for all intents and purposes, the same position.
Across all species, AEQD caused the fewest detectable errors. At regional scales (striped bass), the correct Mercator projection can also be sufficient, but at coastal scales (Atlantic sturgeon) Mercator often leads to large deviations.
3.4 Conclusion
The choice of projection is not consequential for inference from acoustic telemetry data at regional scales (striped bass). When the scale of the species’ movement expands to the coastal scale or across UTM zones, however, Mercator-based projections can lead to mislocation of >50% of acoustic telemetry positions. That the AEQD projection consistently performed well may be due to the coastal nature of the species investigated: while the animals are moving hundreds-to-thousands of kilometers along the coast, they are only moving, or we are only sampling, within tens of kilometers from shore. Further investigation should be done to see if the same results emerge when using technology that can record species with movement ecology that deviate from a dominant axis (PSAT-tagged tuna or sharks, for example). This, however, is beyond the scope of the current project.